Plot — 3D & Slice
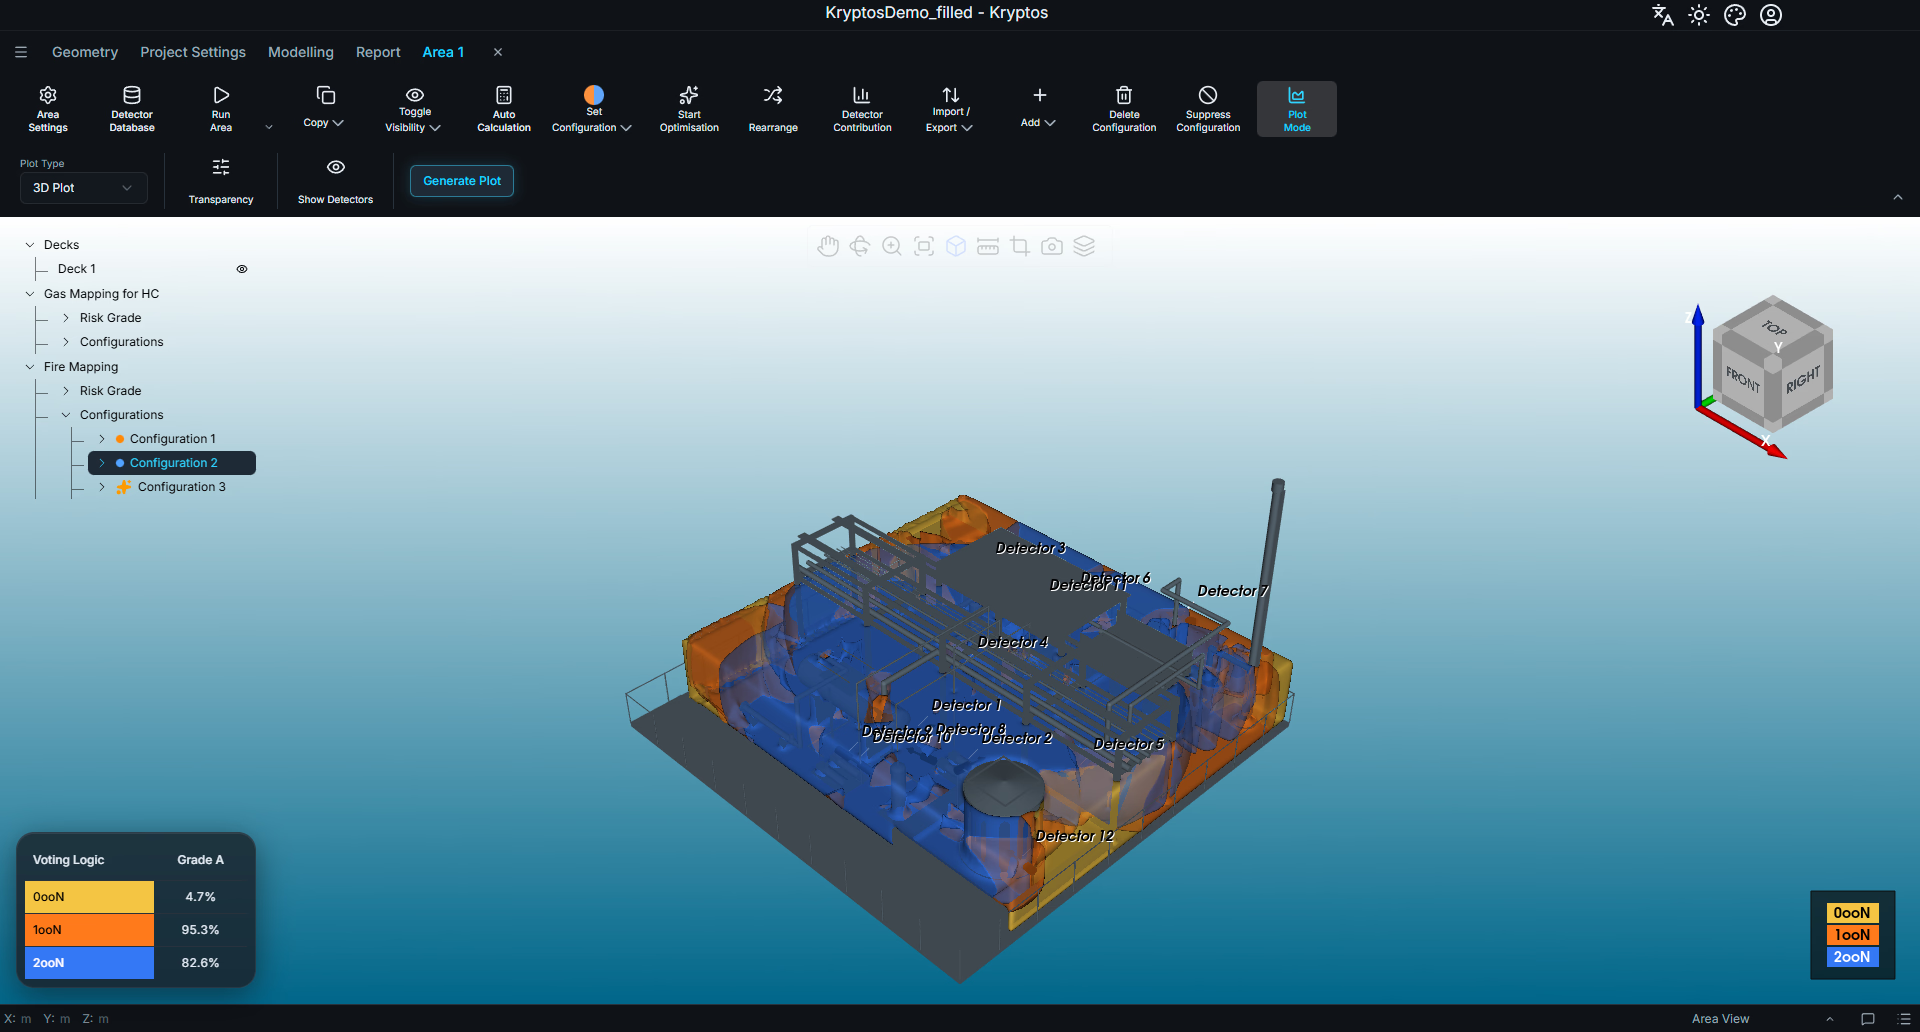
A plot visualises the coverage results of a configuration of detectors in the 3D view. Different colours represent the number of detectors covering each part of the plant: none (0ooN), at least one (1ooN), at least two (2ooN), and so on.
Kryptos provides two types of plot:
- 3D Plot — displays coverage as 3D iso volumes throughout the mapped risk grade .
- Slice Plot — displays coverage on one or more 2D flat planes through the mapped risk grade.
Before You Start
Plots are generated from existing calculation results. The configuration you want to plot must therefore be calculated before you begin.
WARNING
If the configuration has not been calculated, click Run Area in the ribbon and wait for all calculations to finish before generating a plot.
For more information, see Running Calculations.
Turning on Plot Mode
Select the configuration you want to plot in the area tree, then click Plot Mode in the ribbon.
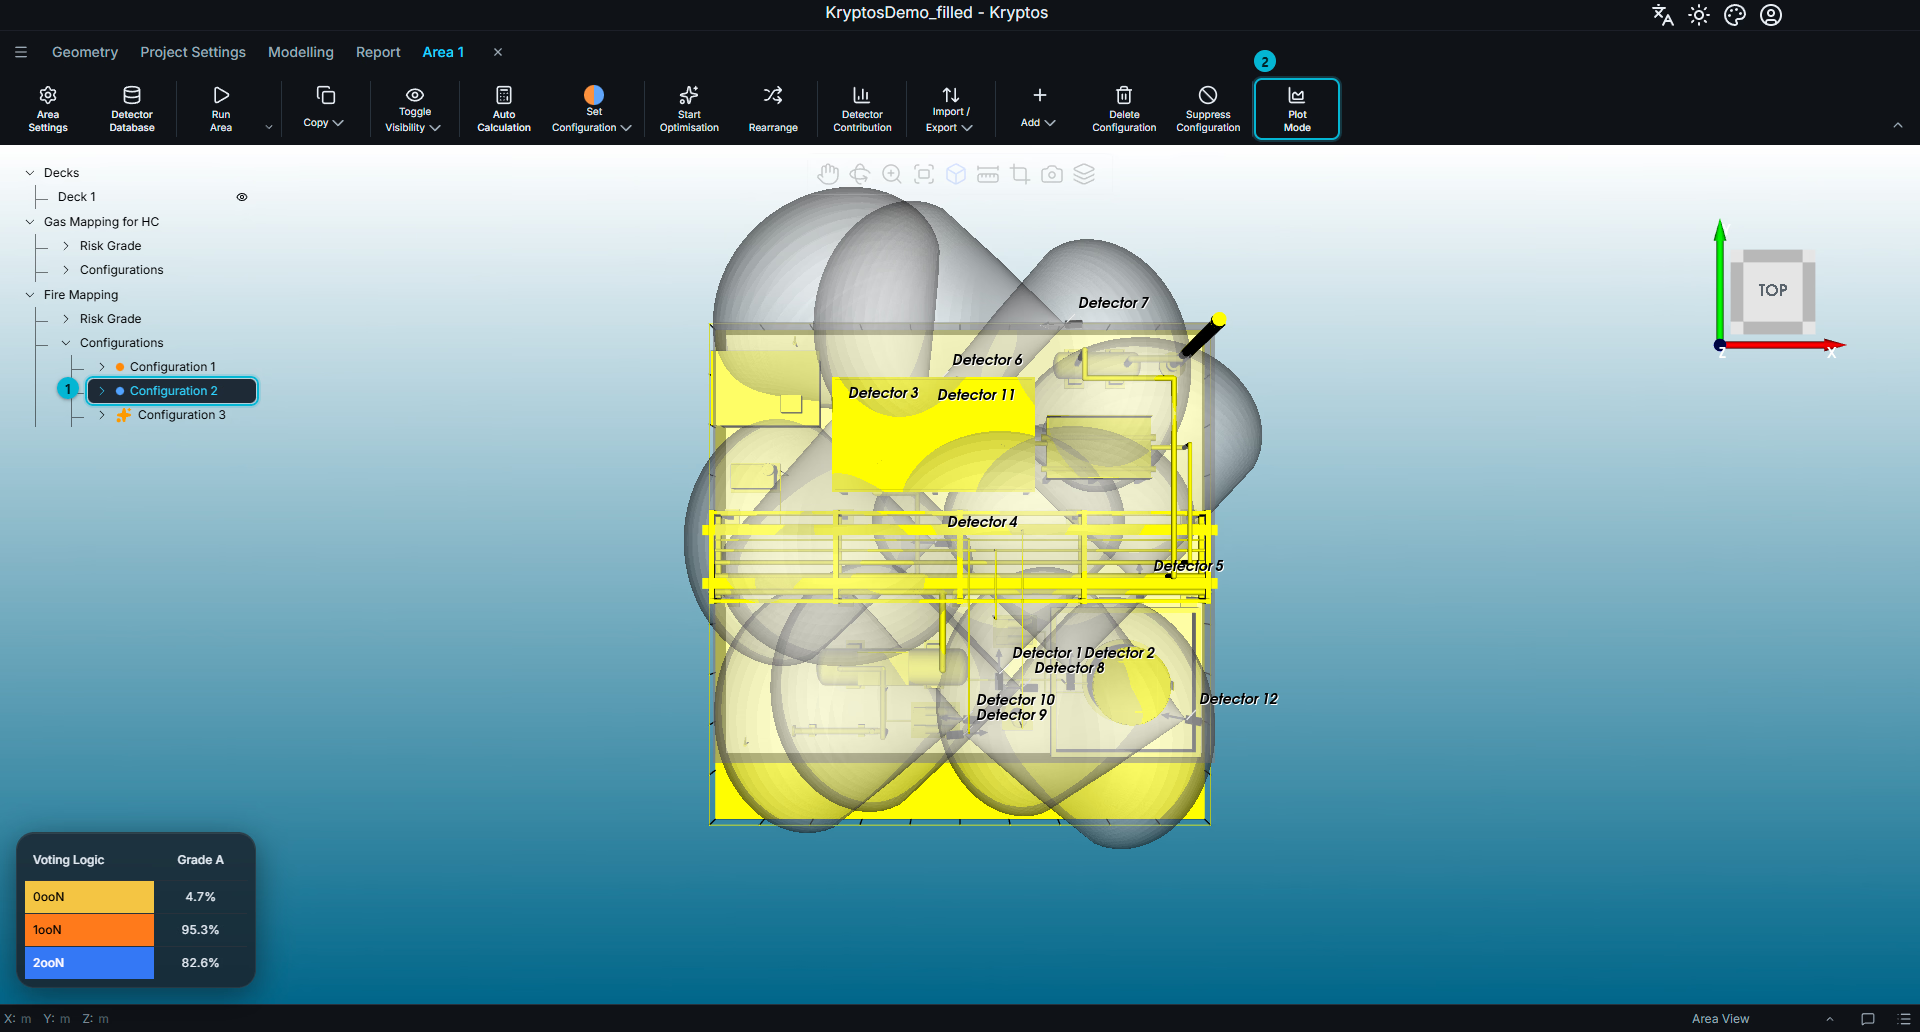
- Configuration — the configuration whose coverage you want to plot. In this example, Configuration 2 under Fire Mapping in Area 1 is selected.
- Plot Mode — turns plot mode on or off. Click the button again to exit plot mode.
When Plot Mode is enabled, an additional row of plot controls appears in the ribbon, and the plant geometry turns grey to make the coverage plot easier to visualise. The area's decks, grades and detectors are hidden while plot mode is active.
3D Plot
3D Plot is the default plot type in Kryptos.
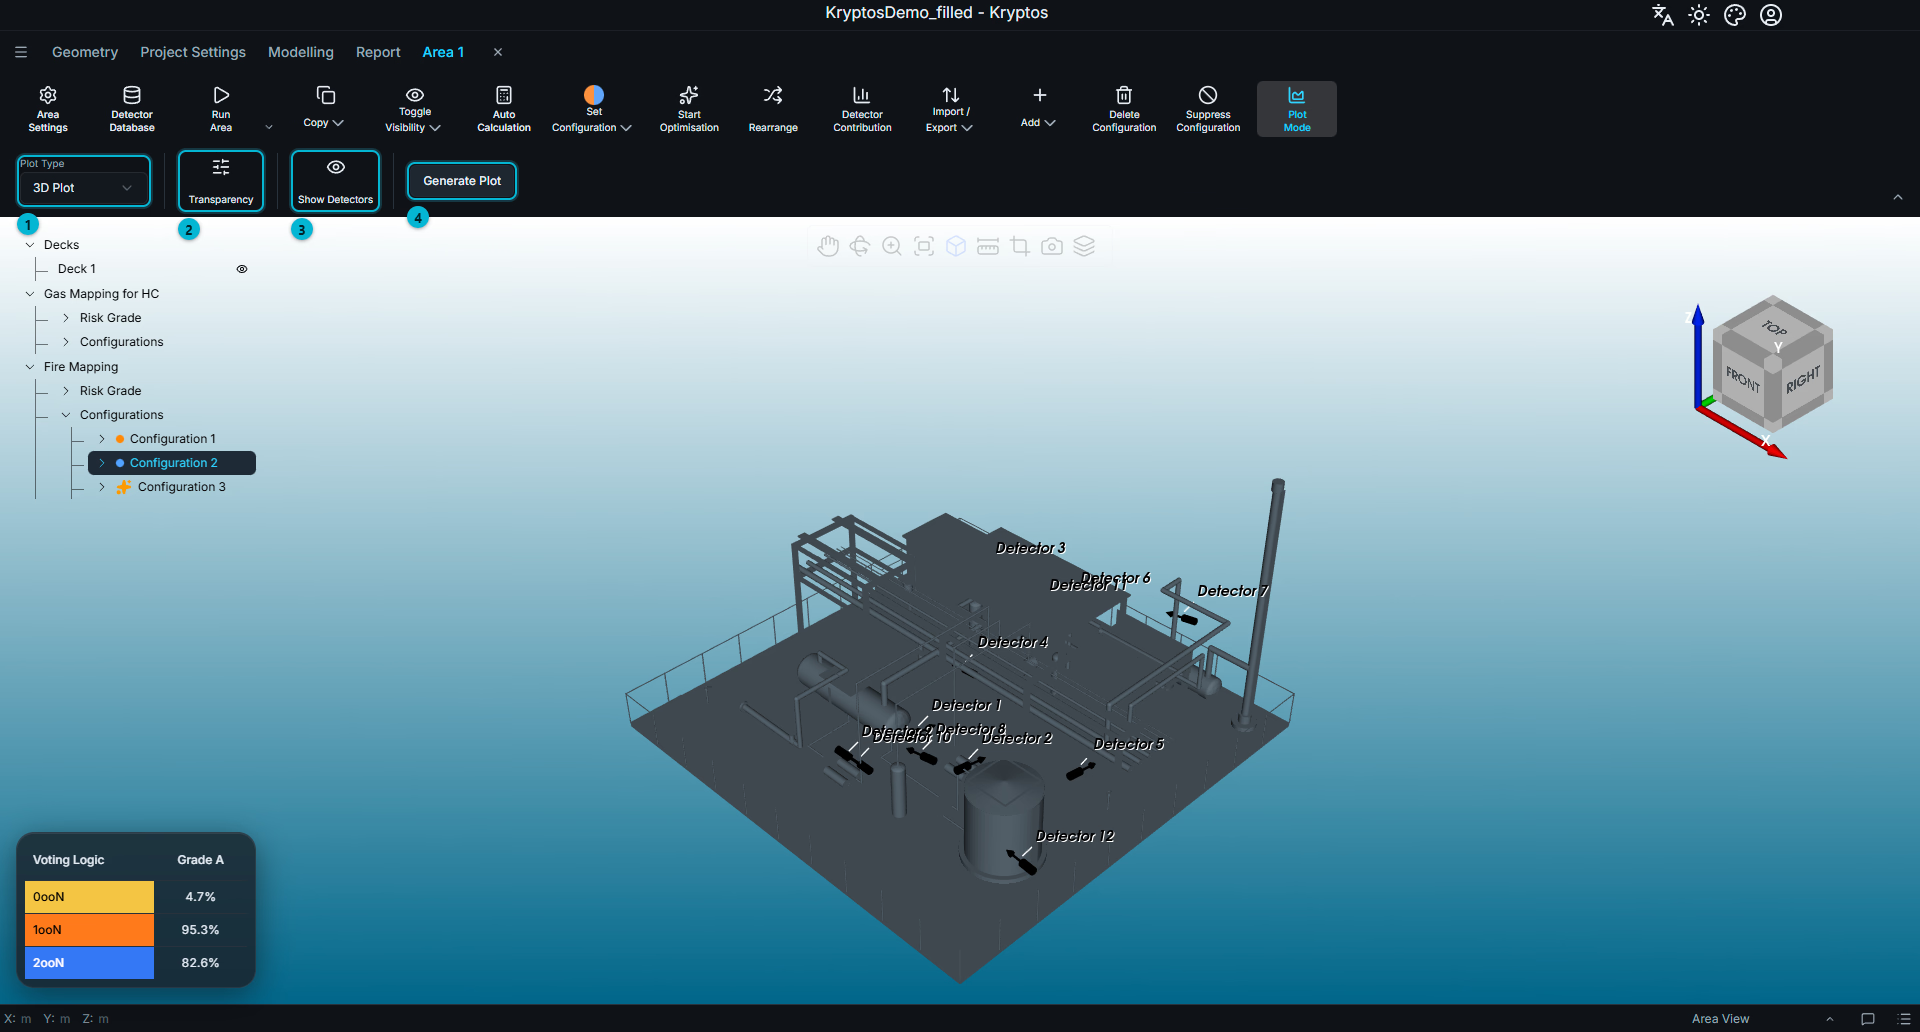
The ribbon provides the following controls:
- Plot Type — selects the plot type: 3D Plot or Slice Plot.
- Transparency — controls the colours and transparency of the individual voting logics.
- Show Detectors — displays the detectors and their fields of influence in the plot.
- Generate Plot — generates the plot for the selected configuration.
Click Generate Plot to show the plot. Depending on the scale and complexity of your model and the computer hardware specification, please allow a few seconds for the plot to be rendered in the 3D view.
Transparency and Colours
Click Transparency to open a panel containing a separate row for each voting logic.
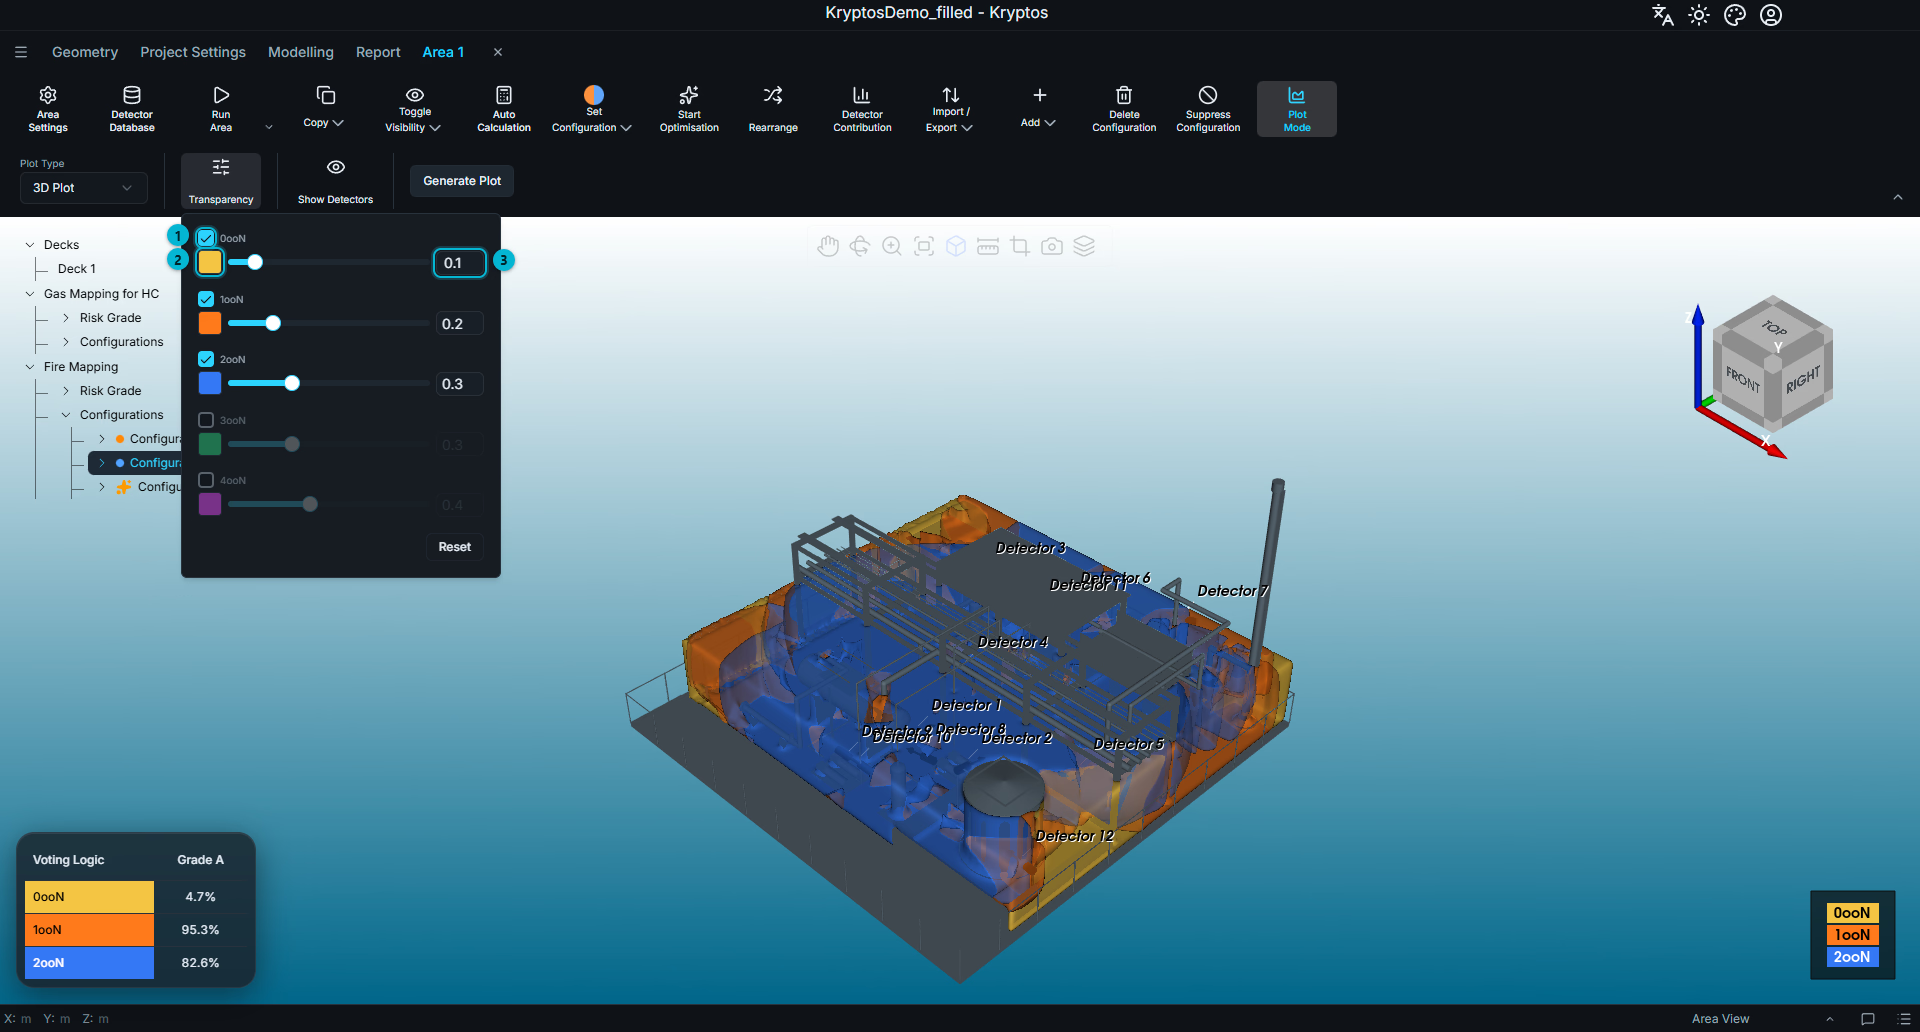
- Enable — untick a voting logic to hide it from the plot.
- Colour — click to select the colour used to represent that voting logic.
- Transparency — adjust the slider to make the voting logic more or less transparent.
Changes are reflected in the plot immediately; you do not need to generate it again.
The colours are shared with Coverage Settings. Changing a voting logic's colour here also changes it in Coverage Settings, and vice versa.
TIP
You can change the colour or transparency only for voting logics that are enabled. If a voting logic is unticked, enable it first to edit its appearance.
Show Detectors
When plot mode is active, the grades and detectors' fields of influence are hidden by default.
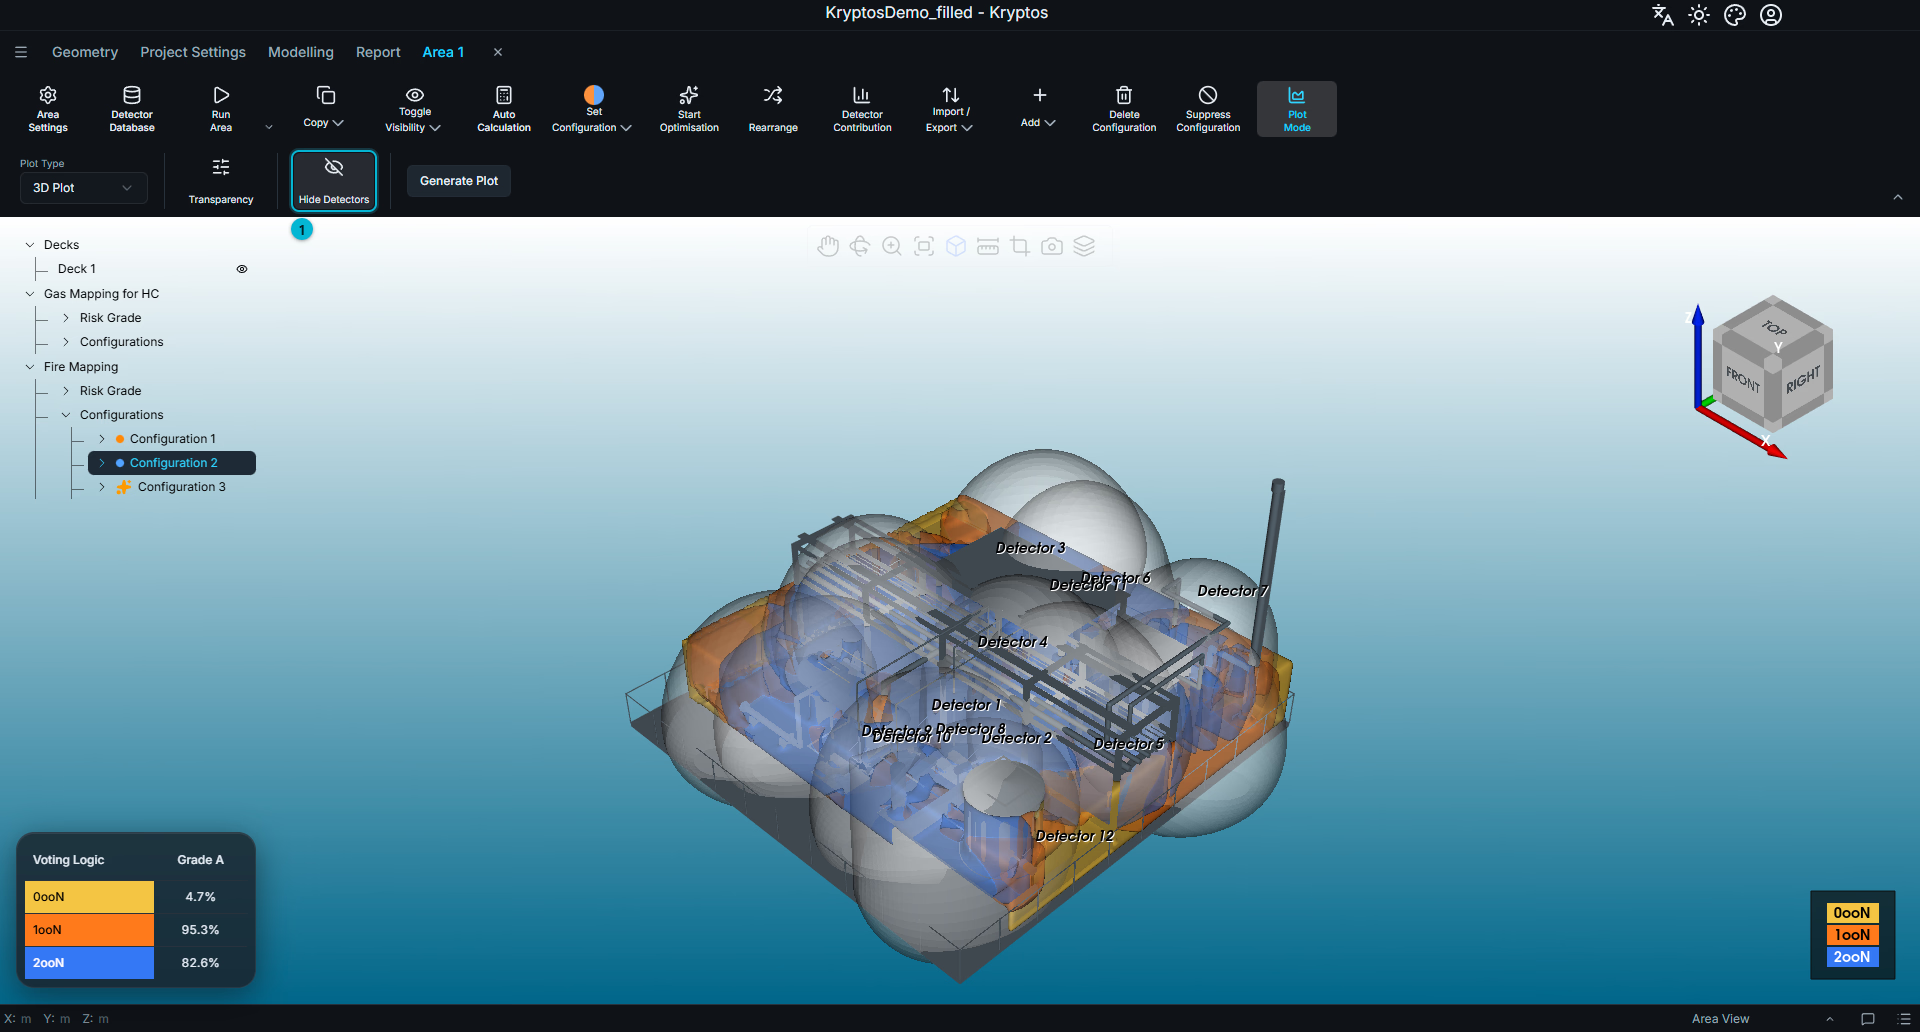
- Show Detectors — displays the detectors and their fields of influence in the plot. The button changes to Hide Detectors; click it again to hide them.
Show Detectors is available only when a configuration or one of its detectors is selected in the area tree.
Slice Plot
A Slice Plot displays coverage on one or more flat planes through the mapped volume. To use it, select Slice Plot from Plot Type. The ribbon changes to show the slice-specific controls.
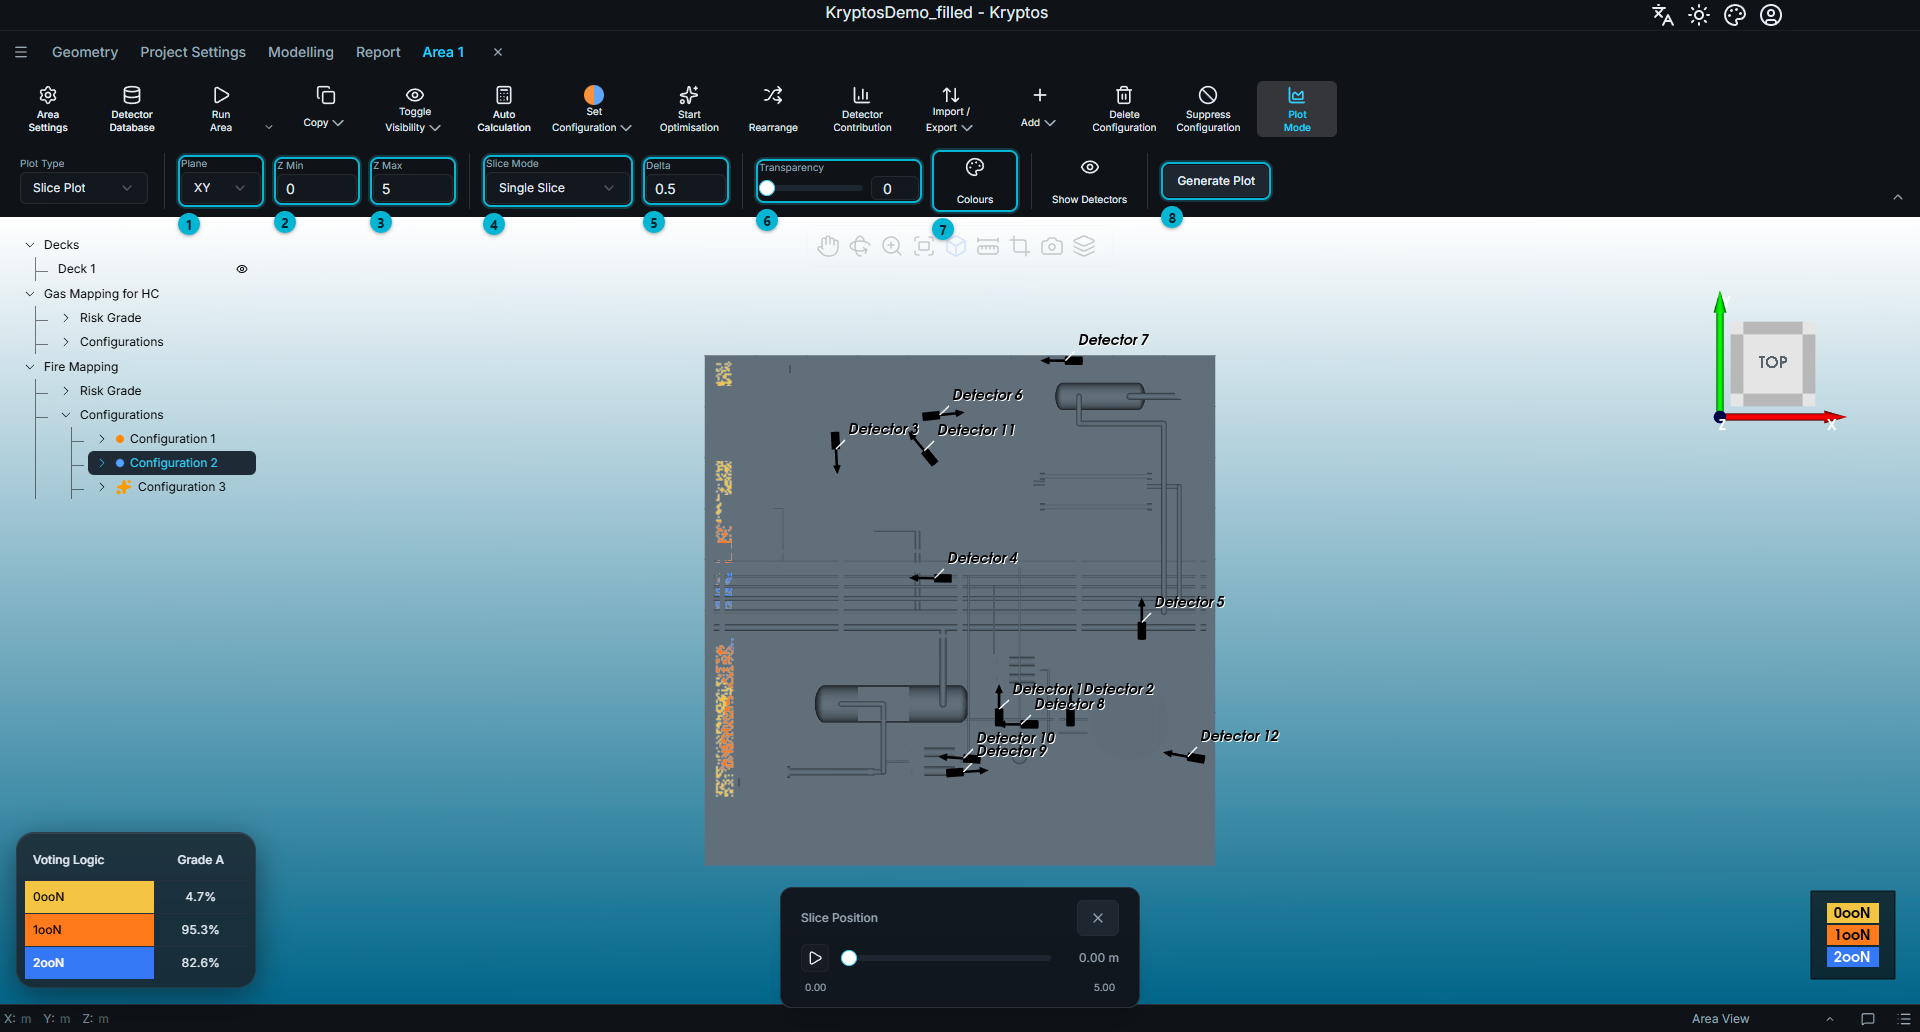
The available controls are:
- Plane — selects the orientation of the slice plane: XY, YZ or XZ.
- Min — sets the lowest position of the slice or slice range, measured perpendicular to the selected plane. For an XY plane, for example, this position is measured along the Z-axis.
- Max — sets the highest position of the slice range, measured along the same direction as Min.
- Slice Mode — selects Single Slice or Multiple Slices.
- Delta — sets the spacing between consecutive slices in Multiple Slices mode. In Single Slice mode, it sets the step by which the slice position changes.
- Transparency — controls the overall transparency of the slice plot.
- Colours — controls the colour and visibility of each voting logic.
- Generate Plot — generates the slice plot using the selected settings.
By default, Min and Max are set to the extent of the mapping's grades. The slice plot therefore covers the entire risk volume unless you specify a different range.
Single Slice
Select Single Slice and click Generate Plot. Kryptos displays a single slice on the selected plane — XY in this example — and a Slice Position slider appears at the bottom of the 3D view.
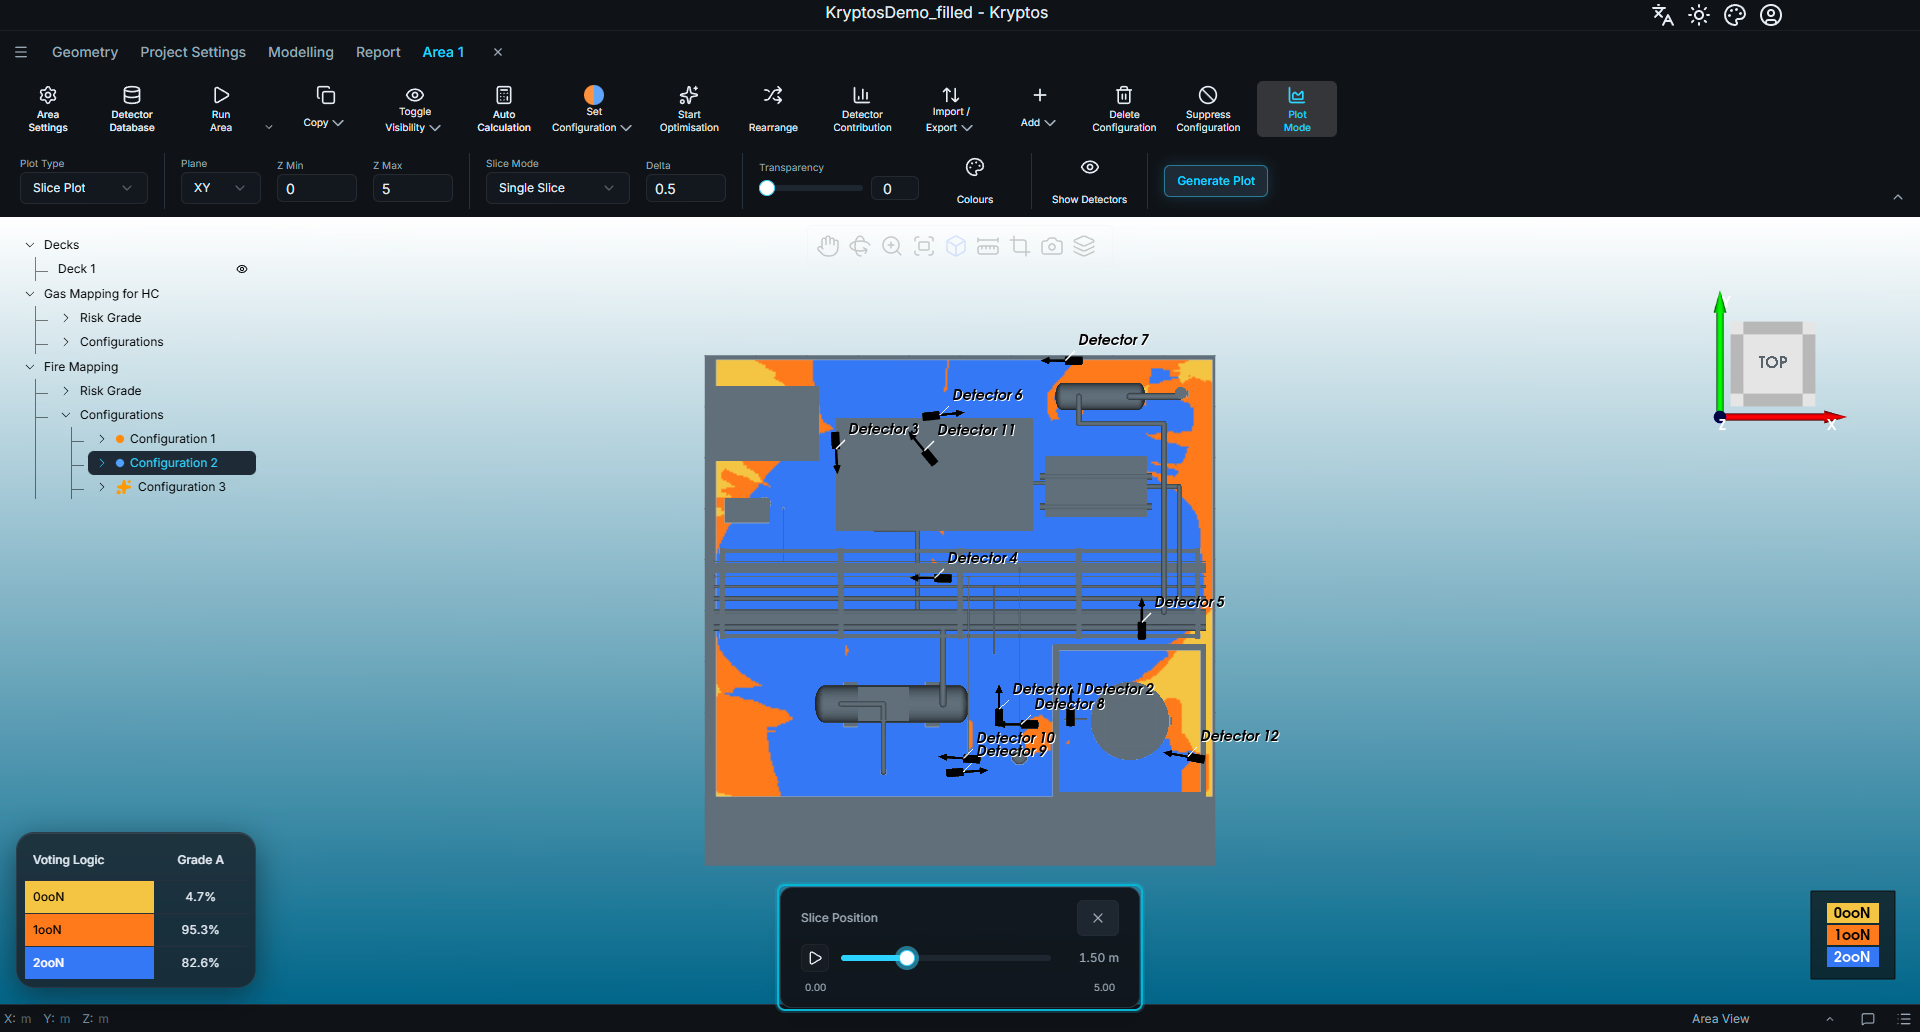
Drag the slider to move the slice between Min and Max. The slice updates as you move the slider, and the value displayed beside it indicates the current slice position.
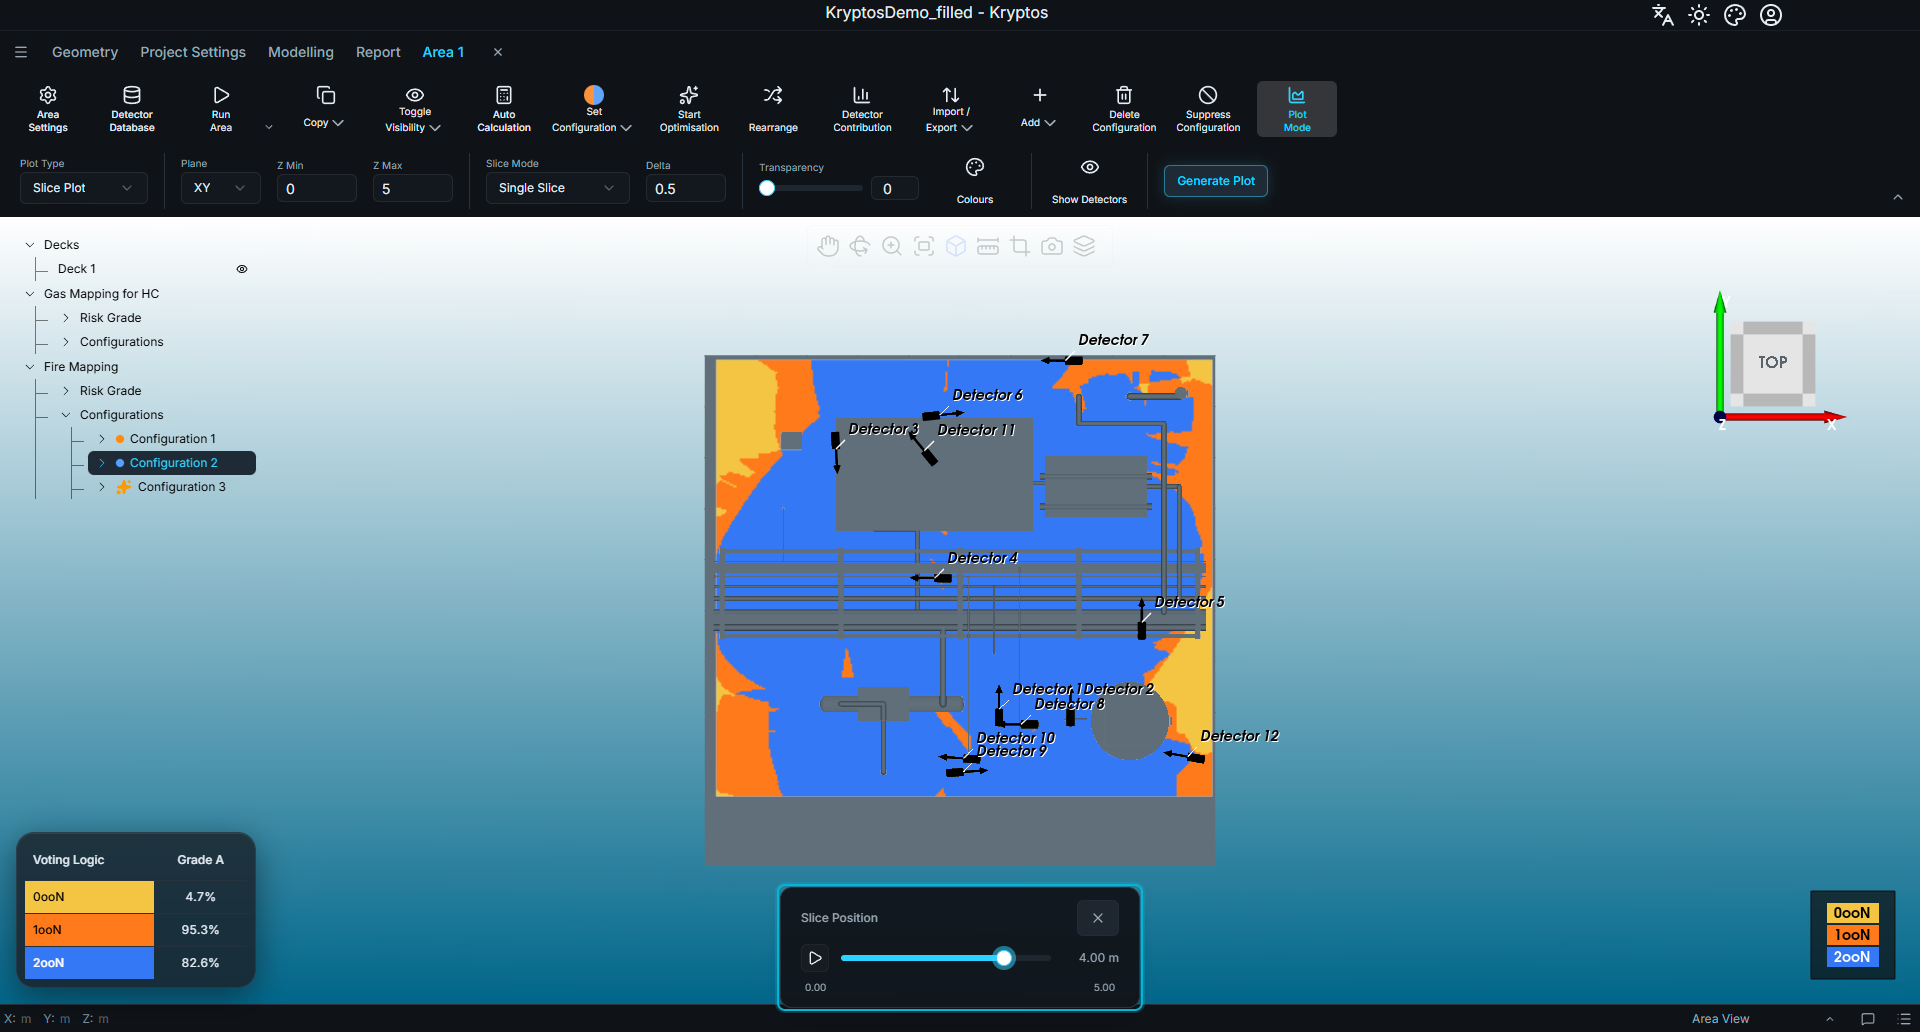
You can also click the play button beside the slider to animate the slice position. The slice moves automatically from Min to Max, advancing by one Delta at a time.
Multiple Slices
Select Multiple Slices to display several slices simultaneously across the specified range. Kryptos generates slices between Min and Max, with the spacing between consecutive slices determined by Delta.
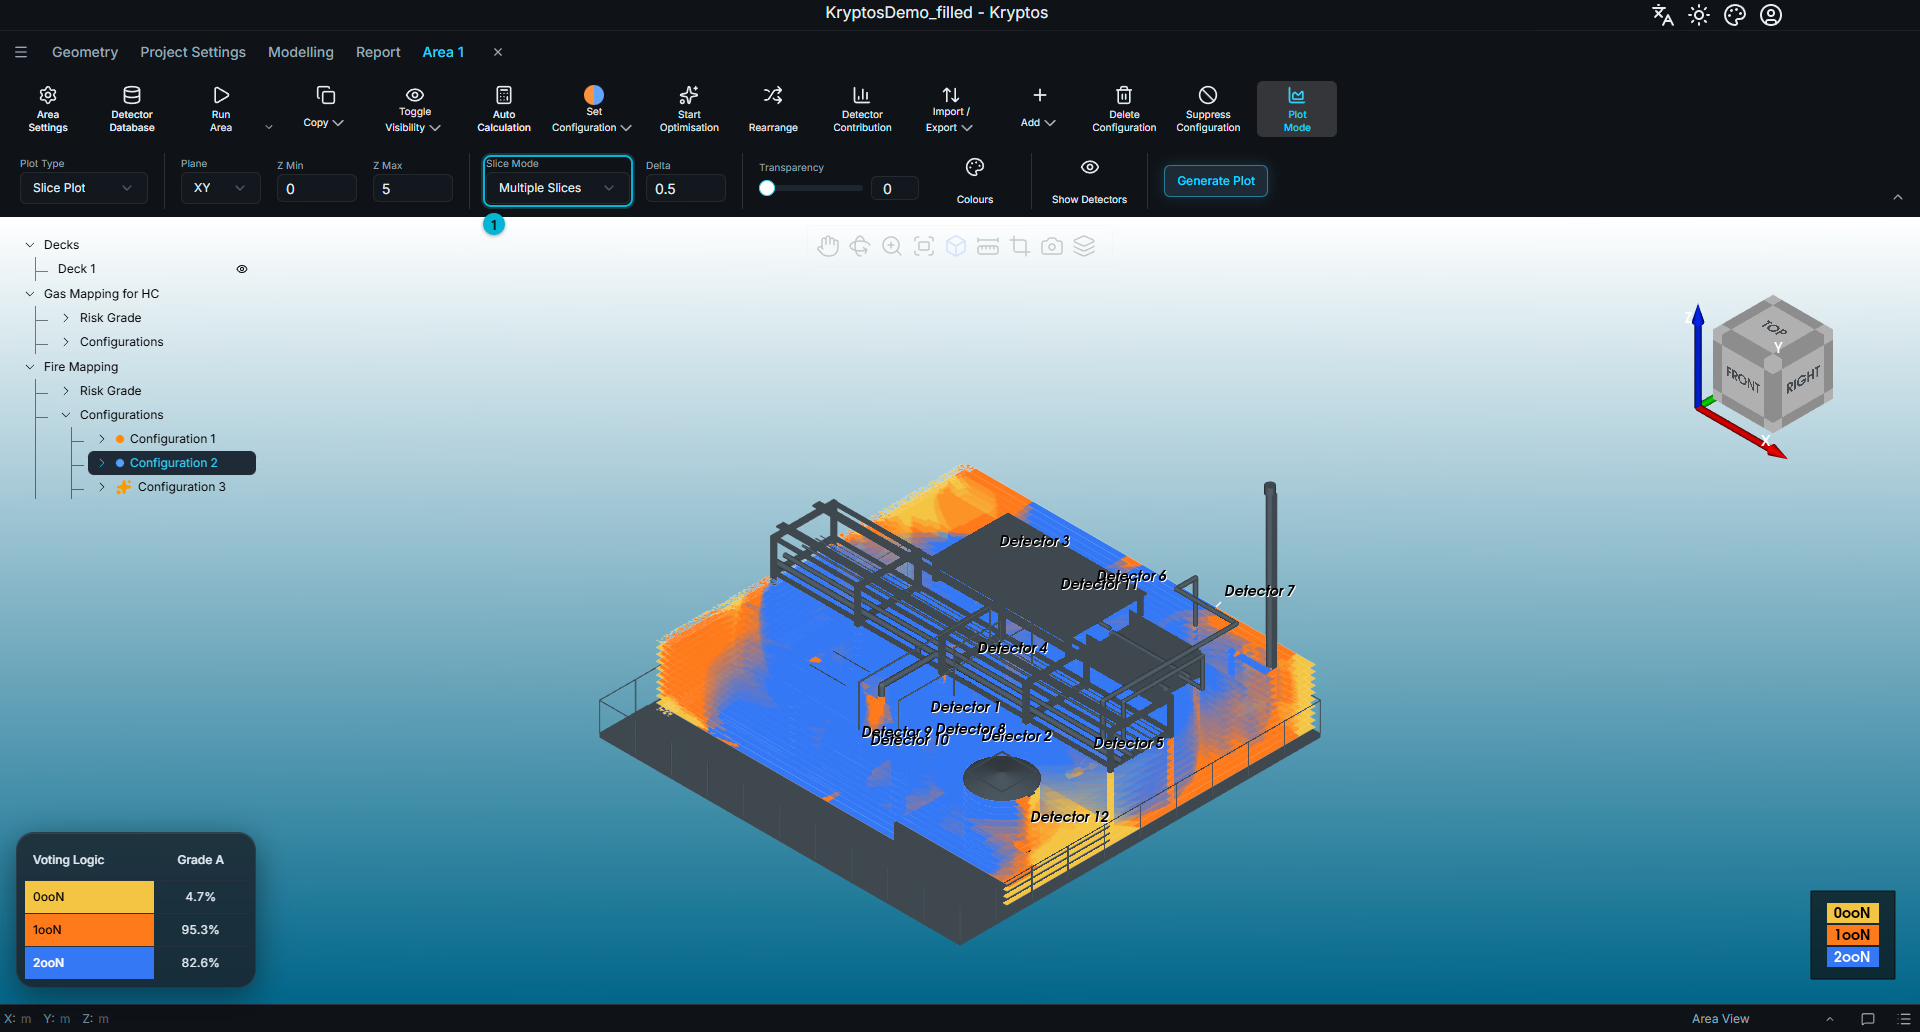
- Slice Mode — set to Multiple Slices to display all slices simultaneously.
TIP
A small Delta over a large range can generate a large number of slices, making the plot difficult to interpret. If the plot appears too crowded, increase Delta or reduce the range by bringing Min and Max closer together.
Related
- Running Calculations — calculating a configuration before generating its plot
- Detector Contributions & Rankings — understanding how individual detectors contribute to the coverage shown in the plot